

Overview
Trends is a set of AI-powered dashboards in the Analytics module. They analyse your bookings, contracts, and occupancy data to predict what is likely to happen next, so you can plan ahead instead of guessing. For example, if Trends shows that bookings dip on Tuesdays, you can send a newsletter or post a promotional offer to fill those quieter slots. If a meeting room is consistently in high demand on certain days, you can use dynamic pricing to raise its price automatically at those times.How to access
Go to Analytics → Trends. Use the buttons at the top of the page to switch between dashboards.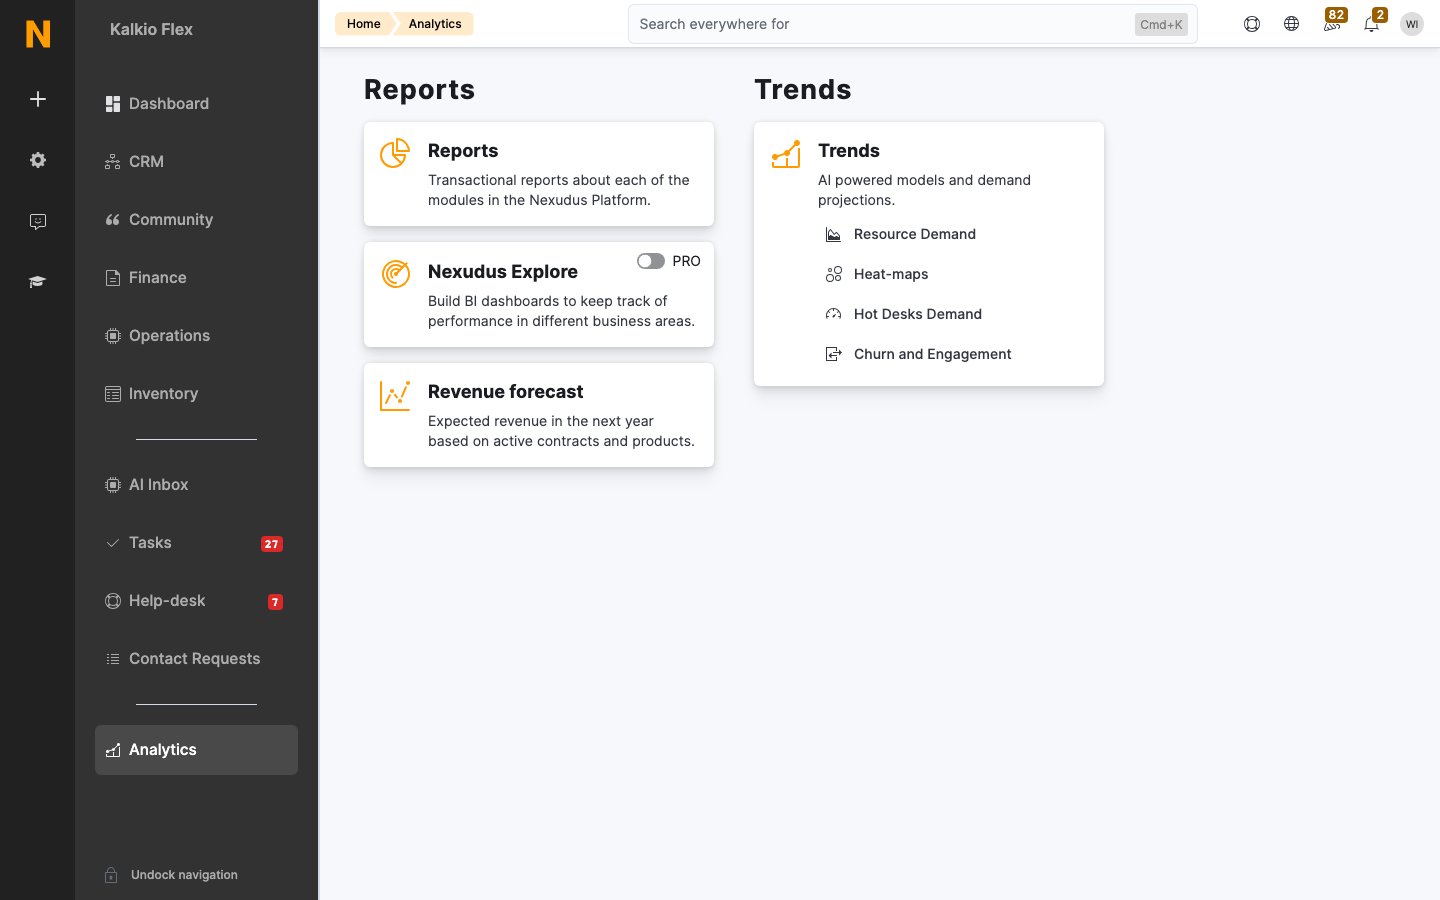
Trends dashboards
How Trends works
Trends uses predictive models that look for patterns in your data and the factors that influence them, such as your opening times and public holidays in your country. The models use these patterns to estimate how likely bookings, occupancy, and cancellations are on future dates. Predictions get more accurate over time. As you record more bookings and contracts in Nexudus, the models learn from the new data and refine their predictions.Trends calculations only cover bookings between 6 AM and 10 PM. If your space is open 24/7, bookings between 10 PM and 6 AM aren’t included.
What you need to use Trends
Trends needs around three months of booking, contract, and occupancy data before it can make reliable predictions. If you’ve used Nexudus for longer than that, your dashboards are already populated. If you’ve just opened a new location, its dashboards fill in at around the three-month mark. Beyond that, each dashboard needs some setup:- All dashboards — Set your opening times in Settings → General settings → Opening times. These times aren’t shown on the Members Portal, but they help Trends treat bookings outside your opening hours as outliers. See Configure Opening Hours.
- Heat-maps and Hot Desk Demand — Set up at least one floor plan and link its items to resources. Items that aren’t linked to a resource aren’t included in the predictions. See Floor Plans.
Resource Demand
The Resource Demand dashboard shows which resources are in high or low demand overall, and when each resource is most and least popular by hour or by day of the week. Select a resource from the drop-down list to see its projected demand, or compare all your resources in the Projected Demand Comparison section. Use this dashboard alongside dynamic pricing to raise prices automatically when a resource is in high demand and lower them when demand drops. See Rates.Heat-maps
The Heat-maps dashboard overlays your floor plans with colours that show where activity is concentrated. Items closer to red have more bookings, and items closer to light purple have fewer. Items with no colour have no bookings for the selected day. Switch between Booked time and Generated revenue to see which items are booked the longest and which bring in the most money. You can also filter items by name, status, type, and area.Hot Desk Demand
The Hot Desk Demand dashboard projects hot desk occupancy for up to four weeks ahead. Select a day, a week, and a floor plan to see the projection.Churn and Engagement
The Churn and Engagement dashboard predicts how many of your members are likely to cancel their contracts over the next 30 days, and how engaged each member is with your space.- Churn is the percentage of active members likely to cancel their contract by the end of the current month. For example, if you have 100 active members at the start of January and your churn rate is 10%, you can expect around 90 active members by the end of the month.
- Engagement is a score that shows how likely each member is to stay. Members are grouped into four tiers: high, medium, low, and none. Members with high engagement are very likely to renew their contracts.
FAQ
Why is my dashboard empty?
Why is my dashboard empty?
Trends doesn’t have enough data to make predictions yet. It usually needs around three months of historical data. If you’ve just opened a new location and it has been busy, you may see some early predictions before the full dashboard fills in.
Why do I see no data after filtering a dashboard?
Why do I see no data after filtering a dashboard?
Each filter you add removes data from the calculations. If too little data is left, Trends can’t make a prediction. This is more likely if you started using Nexudus recently or haven’t recorded many bookings yet. Remove some filters and try again.
How reliable are the predictions?
How reliable are the predictions?
No model can predict demand or churn perfectly, but Trends predictions stay close to your actual figures. They become more accurate the longer you use Nexudus.
Related
- Reports — the detailed numbers behind your bookings and occupancy
- Rates — set up dynamic pricing based on demand
- Floor Plans — the floor plans Heat-maps and Hot Desk Demand rely on
- Configure Opening Hours — the opening times Trends uses